The wellbeing of children and adolescents in Capão Redondo
Measurement: SIC — Social Impact
Organisation: Instituto Rizomas
Location: Capão Redondo, São Paulo
Date: 2025
Introduction
This is the first cycle of social impact measurement at Instituto Rizomas, conducted by SIC (Social Impact) in 2025.
The measurement uses wellbeing as its anchor indicator. Wellbeing, here, is the assessment that a person makes of their own life as a whole, measured by a scientific scale validated across dozens of countries (the Satisfaction With Life Scale, Ed Diener, 1985). The rationale for this choice and the details of the instrument are presented in the following section.
The objective was to build an initial snapshot of the wellbeing of the children and adolescents served by the programme, identify which factors most matter for this wellbeing, and assess signals of association between participation in Rizomas and the observed outcomes.
This report was designed to be read after the Results Report. It details the measurement approach, the rationale behind methodological choices, and presents the full results with the analytical context required to interpret them.
This report covers the measurement of capabilities and opportunities and their relation to wellbeing. It does not address the programme's academic and cognitive outcomes — literacy, mathematics, or English performance. Those outcomes exist and are documented in the Results Report. What is here is the layer that sits underneath them. The internal and external conditions that allow those outcomes to happen and to be sustained.
The 2025 cycle was designed as a pilot. It allowed us to test the data collection instruments, calibrate the questions to the reality of the territory, and generate the first evidence about how the programme works. From 2026 onwards, measurement will include longitudinal follow-up of participants, with repeated measures that will make it possible to observe individual change over time.
PART 1: Measurement approach
This section explains how we measure social impact and why we chose to measure it this way.
Rationale for the Measurement Approach
Methodological credit. This report applies the Huber Social Wellbeing Measurement Framework, developed in Australia and codified in SA HB 204:2022, the Standards Australia handbook on social impact measurement that Huber Social led with Oxford University's Blavatnik School of Government, Trust Waikato, and Sweef Capital. Full credit for the methodology belongs to Huber Social and its co-authors.
Why wellbeing as the anchor indicator
The central question of any social impact measurement is: are these people's lives better?
To answer it, you need an indicator that captures life as a whole, not an isolated dimension. A school grade can rise without any change in life conditions. A health indicator can improve while social relationships deteriorate. Life is interconnected, and a fragmented indicator can show progress where none exists.
We chose subjective wellbeing as the indicator, measured by the Satisfaction With Life Scale (SWLS), developed by Ed Diener in 1985. The SWLS is one of the most widely used and validated instruments in the psychology of wellbeing. It assesses how a person judges their own life globally, based on five statements about overall satisfaction.
Researchers have validated the scale across dozens of countries and in diverse populations, including Brazil (Gouveia et al., 2009). Its psychometric robustness is documented across more than three decades of research use. Pavot and Diener (2008) reviewed the studies accumulated since the original publication and confirmed that the SWLS shows high internal consistency, adequate temporal stability, and sensitivity to real changes in life conditions.
For application with the children and adolescents at Rizomas, we adapted the scale's language to ensure comprehension, while preserving the original structure. We tested the adaptations with a pilot group of 5 participants before applying it to the full group.
Wellbeing functions as the top of the measurement. It tells us whether life is better or worse. But on its own, it doesn't tell us what to do. To act, we need to understand what pulls this number up or down.
What moves wellbeing: capabilities and opportunities
The measurement is organised in three levels. Wellbeing is the anchor indicator. Below it are the outcomes — the dimensions that influence wellbeing, divided into capabilities (what a person can do and be) and opportunities (what the environment offers). Below the outcomes are the factors — the specific, measurable indicators within each outcome.
The distinction between capabilities and opportunities is not merely conceptual. It determines action. If a factor is a capability with a low level, the path is to develop it. If it is a missing opportunity, the path is to provide access. Confusing the two wastes resources. A programme that tries to "teach resilience" when what's missing is a trusted adult is aiming at the wrong place.
The Huber Social framework does not impose a fixed view of what matters for wellbeing. Instead, it asks each population what drives their wellbeing locally, and then measures those drivers. This is why the 10 outcomes used in this report were not selected from a generic list — they emerged from the territorial listening described in the next section.
How the outcomes and factors were identified
The selection of what to measure followed a three-step process.
First, listening. Before defining any instrument, the SIC team held conversations with the people who live the programme's reality: the young people themselves, their parents and family members, educators, pedagogical coordination, social workers, and members of the Capão Redondo community. The goal was to understand, from lived experience, what influences these children and adolescents' lives, what makes a difference day to day, what is missing, and what is working.
Second, the action filter. From everything that emerged in the listening phase, not all of it can be measured usefully. Factors like sanitation, public safety, and family income came up in the conversations as real and serious problems. But Rizomas cannot change the neighbourhood's infrastructure or the city's public safety policy. Measurement prioritises factors over which the programme has capacity for influence. This doesn't mean ignoring the context. It means recognising that the programme's role is to develop in children and adolescents the capabilities, and to provide the opportunities, that allow them to develop even within an adverse environment.
Third, grounding in the evidence base. The factors identified in the listening phase — already filtered by the programme's capacity to act — were then cross-referenced against a proprietary evidence base built and curated by Huber Social together with its measurement partners, including SIC (Social Impact). This evidence base aggregates more than a decade of peer-reviewed research on child and adolescent development, is continually updated, and is indexed by programme purpose, mission, target demographics, and contextual variables — so that each project's measurement design is anchored in research directly relevant to its population. Cross-referencing against this base, rather than ad-hoc literature searches, is what allows the framework to combine local listening with consolidated scientific evidence in a reproducible way. The result is 10 outcomes (5 capabilities and 5 opportunities) broken down into approximately 40 measurable factors, each with a corresponding question in the data collection instrument.
How to read the numbers in this report
This section explains the main statistical indicators that appear in the report's tables. Knowing these concepts transforms how the results are interpreted — it makes it possible to separate solid findings from variations that could have occurred by chance.
You don't need to be a statistician to understand. Each concept is explained with the story it tells, not the formula behind it.
ρ (rho) — Spearman correlation
Measures how much two things vary together. Ranges from −1 to +1.
ρ = +0.50 means: when one goes up, the other also goes up (moderate positive relationship). ρ = −0.50 means: when one goes up, the other goes down. ρ = 0 means: they don't move together.
Concrete example: the correlation between "Habits and routines" and wellbeing is 0.50. This means that young people with more consolidated habits and routines tend to report higher life satisfaction — and vice versa. It is not an automatic relationship, but a clear tendency.
p (p-value) — The question "could this be chance?"
The p-value answers: if the true effect were zero, what is the probability of observing a result as strong as the one we measured, purely by sampling chance?
By convention, if p < 0.05, the result is considered "statistically significant" — unlikely to be chance.
Concrete example: a correlation of 0.50 with p = 0.002 means: if there were truly no relationship between the two variables, the chance of observing ρ = 0.50 or stronger would be only 0.2%. Very unlikely. A reliable result.
A correlation of 0.15 with p = 0.18 means: this could be just random variation. We can't conclude anything.
95% CI — Confidence Interval
The number we report (ρ = 0.46, for example) is the best estimate we can produce with the available data. But it's an estimate, not absolute truth. With a different sample, the number would be slightly different.
The 95% confidence interval shows the range in which the true value most likely lies. The narrower it is, the more precise the estimate.
Concrete example: ρ = 0.46 with 95% CI [+0.27, +0.62] means: our best estimate is 0.46, but the true value could be between 0.27 and 0.62. It is still a positive correlation, but the range is wide because the sample is small (n=78). In future cycles with more participants, the range becomes narrower and the estimate becomes more precise.
n — Sample size
How many people are being compared in each analysis. It matters a lot.
The main analysis used the 78 respondents. But comparisons between subgroups (for example, newcomers vs. 2+ years in programme) work with far fewer. The smaller the n, the more fragile the result. Differences that look large may not be reliable if the subgroup is small.
Concrete example: the wellbeing comparison between adolescents with 0–1 year (n ≈ 7) and 3 years (n ≈ 13) is made with only 20 people. The observed difference is large, but the small n means the result needs to be confirmed in subsequent cycles before becoming an assertion.
Cliff's δ — Effect size
Significance (p) tells whether an effect exists. Effect size (Cliff's δ) tells how big it is.
A test can be significant (p < 0.05) but the effect can be too small to have practical relevance. Reporting both avoids confusing "statistically different" with "practically important".
How to read Cliff's δ:
|δ| < 0.15 → negligible
|δ| ≈ 0.15–0.33 → small
|δ| ≈ 0.33–0.47 → medium
|δ| > 0.47 → large
FDR correction — Testing many hypotheses at once
When testing many correlations at the same time (for example, 10 outcomes against wellbeing), the risk of a false positive increases. With 10 simultaneous tests at p < 0.05, we would expect about 0.5 "finding" by pure chance, even if nothing real existed.
The FDR (False Discovery Rate, Benjamini-Hochberg method) correction adjusts the p-values to control this rate. Results that survive FDR correction are more robust.
How it appears in the tables: we show the raw p (uncorrected) and the p (FDR). The "Signif." column marks ✓ only when the finding survives the correction.
From here on, the report's tables use these indicators. There is no need to memorise — just consult this section when a question arises.
Theory of Change of Instituto Rizomas
The Rizomas theory of change begins with a premise. Cognitive capabilities develop better when socioemotional skills are already being built. And socioemotional skills consolidate when the environment allows them to be practised safely. Rizomas operates within this cycle.
This theory is tested empirically in Part 3 of this report, through mediation analysis.
1. Impact
Improve the wellbeing of children and adolescents in contexts of vulnerability, so that they are in the best position to reach their potential and live a life they value.
2. Outcomes
Rizomas reaches this impact by developing capabilities and providing access to opportunities.
Emotional awareness, perception of body signals, regulation strategies, recovery after frustration
Social Skills
Empathy, respectful communication, resistance to peer pressure, non-aggressive conflict resolution
Responsibility
Keeping commitments, care for belongings, habits and routines, honesty and integrity
Future Orientation
Self-efficacy, hope (dreams and pathways), perseverance
Opportunities
Trusted Adult
Reference adult, clear and useful guidance, encouragement, fair structure and limits
Nurturing Environment
Psychological safety, clear and fair rules, predictability, respectful conflict resolution
Positive Peer Relationships
Pro-social norms, positive friendships, group support, belonging
Recognition
Specific praise, valuing effort, feedback with a next step, high expectations
Personal Development
Meaningful learning, application of learning, agency, positive role models
3. Outputs
The direct results of the activities delivered by Instituto Rizomas.
4. Activities
Actions taken or work undertaken to deliver outputs, outcomes, and impact.
5. Inputs
Financial, human, and material resources invested in creating and operating the programme.
Study Design
Objective
To generate an initial snapshot of the wellbeing of Instituto Rizomas participants, identify the factors most associated with this wellbeing, map priority needs and strengths, and assess signals of association between participation in the programme and the observed outcomes.
Sample
The target population was the 88 young people who completed the 2025 year of the Instituto Rizomas after-school programme. Of these, 78 responded to the questionnaire — a response rate of 89%. The programme serves a larger number of young people throughout the year; the 88 are those who completed the full 2025 cycle.
N
%
Completed the 2025 year
88
Participants assessed
78
89%
Children (up to 11 years)
47
60%
Adolescents (12–17 years)
31
40%
Territory
Capão Redondo, São Paulo
Collection period
2025
On margin of error: the ±3.6% margin commonly reported in studies like this refers to the response proportion (78 of 88 — nearly everyone was interviewed). For estimates within the group of 78, the effective margin is larger — approximately ±11% for proportions and variable for correlations (see 95% CI column in each table). This report reports CI for all main analyses.
Participants were divided into subgroups for comparative analyses: by time in programme (newcomers vs. 2+ years), by attendance (high ≥90% vs. low ≤73%), and by participation in the Sunday socioemotional activities (participates vs. does not participate).
Instruments
General wellbeing was measured by the Satisfaction With Life Scale (SWLS), adapted in language for the context and age range of participants, while maintaining the original five-item structure.
Outcomes and factors were measured by 5-point Likert scales, converted to a 0–100 scale for ease of interpretation. Each outcome contains 3 to 4 factors, each factor measured by specific items. In total, approximately 40 factors were measured.
Analysis
Method
Application
Spearman correlation (ρ)
Relationship between factors and wellbeing
Mann-Whitney U test
Comparison between subgroups
Cliff's δ
Effect size (practical magnitude)
95% CI — Fisher z
Plausible range of correlations
FDR correction (Benjamini-Hochberg)
False positive control in multiple testing
Significance
α = 0.05
Wellbeing scale
Adapted SWLS (Diener, 1985)
Factor scale
Likert 1–5, converted to 0–100
Mediation analysis
Bootstrap, 5,000 samples
Design and its implications
This cycle used a cross-sectional design, measuring all participants at a single point in time. Between-group comparisons (for example, newcomers vs. participants with 2+ years) show association, not causation. It is possible that profile differences between groups explain part of the observed results.
From the 2026 cycle onwards, measurement will include longitudinal follow-up, with repeated measures of the same participants over time. This will allow us to observe individual change and strengthen the evidence about the programme's effect.
PART 2: The Initial Diagnostic*
*Normally, this part of the report would be the baseline. Since we ran the assessment at the end of the year, we renamed it Initial Diagnostic. In early 2026 we will collect the baseline with new entrants into the after-school programme.
Diagnostic
This section presents the full results of the measurement. The Results Report highlights the central findings. Here, all data are presented with the analytical context required to interpret them — and now with the statistical rigor indicators explained in the previous section.
General wellbeing
The group's mean wellbeing is 67.8 on a 0–100 scale, with median 69.4 and standard deviation 11.8. The range falls between "slightly satisfied" and "satisfied". The general Brazilian average on the SWLS is approximately 63 (Gouveia et al., 2009, the most recent available reference with the SWLS in Brazil).
Group
n
Mean
SD
Median
95% CI of the mean
Full group
78
67.8
11.8
69.4
[65.2; 70.5]
Children (≤11 years)
47
69.7
9.6
70.4
[66.9; 72.4]
Adolescents (12–17)
31
65.0
14.4
63.3
[60.0; 69.9]
Children vs adolescents comparison: 4.7-point difference in favour of children. Mann-Whitney U = 844, p = 0.238. Cliff's δ = +0.16 (small effect). The difference is not statistically significant in this sample. In future cycles with a larger n, it is worth tracking — adolescence tends to bring a drop in wellbeing, and the programme may be cushioning that effect.
The absolute level of wellbeing serves as a starting point. Each territory and each population has a different reality, and comparing absolute numbers across different contexts is of limited use. What matters is how aligned the programme is with the needs that most influence participants' wellbeing, and, over time, how much it manages to lift it.
Drivers of wellbeing
We computed each outcome's correlation with wellbeing to identify the key drivers of wellbeing for these young people. Now with p-value, confidence interval, and FDR correction.
#
Outcome
Type
Score
ρ
p (FDR)
95% CI ρ
n
Signif.
1
Nurturing Environment
Opportunity
63
+0.59
<0.001
[+0.42; +0.72]
78
✓
2
Future Orientation
Capability
67
+0.57
<0.001
[+0.40; +0.70]
78
✓
3
Recognition
Opportunity
65
+0.55
<0.001
[+0.37; +0.69]
78
✓
4
Positive Peer Relationships
Opportunity
63
+0.51
<0.001
[+0.32; +0.66]
78
✓
5
Emotional Regulation
Capability
50
+0.50
<0.001
[+0.31; +0.65]
78
✓
6
Responsibility
Capability
64
+0.49
<0.001
[+0.30; +0.64]
78
✓
7
Trusted Adult
Opportunity
63
+0.41
<0.001
[+0.20; +0.58]
78
✓
8
Self-Management
Capability
57
+0.40
<0.001
[+0.19; +0.57]
78
✓
9
Personal Development
Opportunity
69
+0.30
0.009
[+0.08; +0.49]
78
✓
10
Social Skills
Capability
60
+0.25
0.025
[+0.03; +0.45]
78
✓
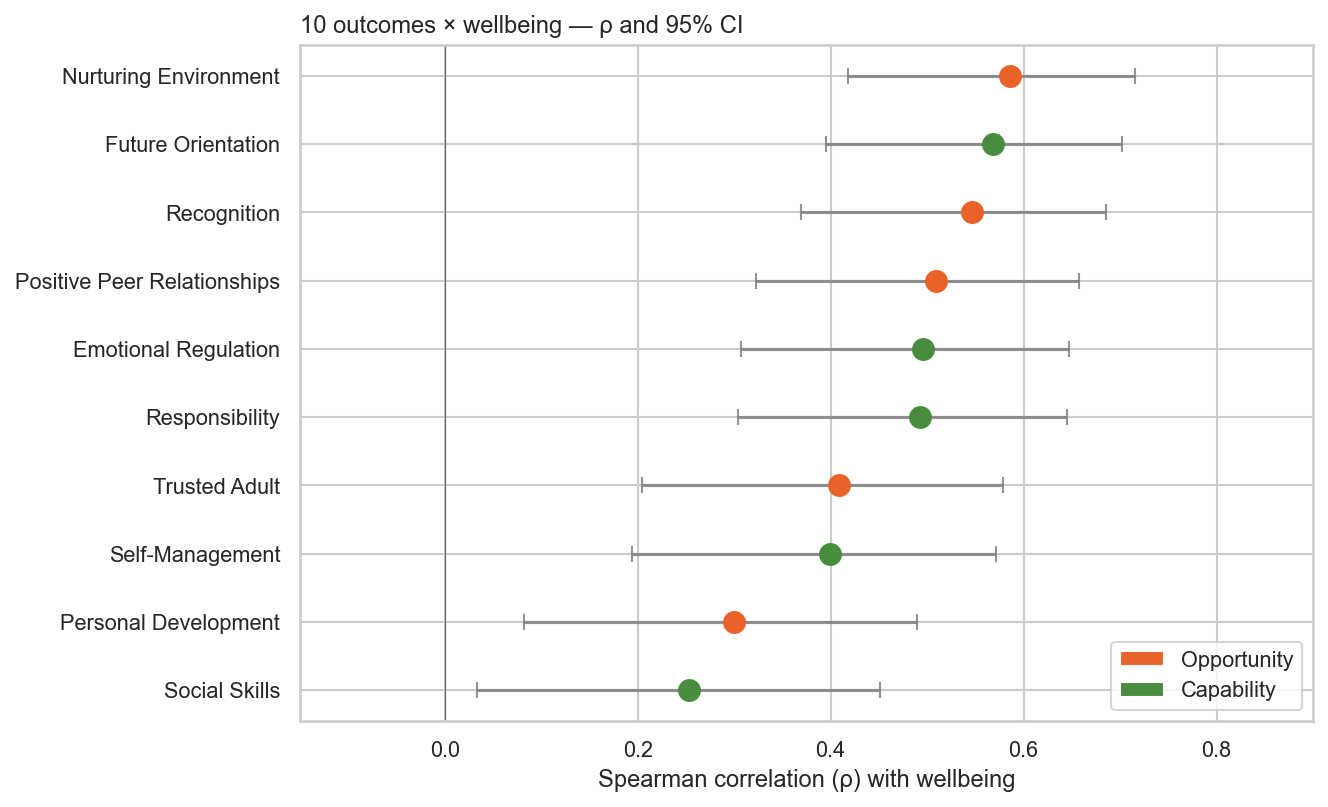
Figure 1. Forest plot of the 10 outcomes correlated with wellbeing. Each point is the Spearman correlation; the horizontal bars show the 95% confidence interval. Opportunities in orange, capabilities in green. The width of the CI reflects the uncertainty of the estimate, naturally wide with n=78.
All 10 outcomes show statistically significant correlation with wellbeing. Three of the five strongest drivers remain opportunities. For these children and adolescents, the surrounding context pulls wellbeing more than isolated individual capabilities — but the effect of capabilities is also real and measurable.
This does not diminish the importance of capabilities. It means that, for this group, opportunities function as a precondition. Without safety, without bonds with trusted adults, without recognition, capabilities such as emotional regulation and self-management have less room to develop. Rizomas works on both fronts at once. It builds the environment and develops the capabilities that this environment allows to strengthen.
Note: The 2025 analysis grouped children and adolescents together in the general correlations. Throughout the process, we identified that this masks relevant developmental differences. Future Orientation is a good example. For a 7-year-old, projecting the future carries little weight day to day. For a 15-year-old adolescent, the capability to envision a viable future works as a central protective factor. When the two groups enter the analysis together, one dilutes the other. The age moderation analysis in Part 3 shows exactly where this happens. From 2026, children and adolescents will be assessed separately.
Priority needs
Priority needs are factors with significant correlation with wellbeing and still-low scores. They are where there is most room for growth and the greatest potential return on the programme's investment: dimensions that demonstrably matter for wellbeing but are still weak in this group. All priority needs are internal capabilities — skills the programme can develop.
Factor
What it means
Score
ρ
p (FDR)
95% CI
Signif.
Outcome
Regulation strategies
Using a pause, breathing, or reappraisal to calm down
44
+0.41
<0.001
[+0.21; +0.58]
✓
Emotional Regulation
Emotional awareness
Recognising what you're feeling and putting it into words
48
+0.40
<0.001
[+0.20; +0.57]
✓
Emotional Regulation
Keeping commitments
Following rules even when no one is watching
61
+0.38
0.002
[+0.17; +0.55]
✓
Responsibility
Body signal perception
Noticing body signals when getting overwhelmed
54
+0.36
0.002
[+0.15; +0.54]
✓
Emotional Regulation
Cognitive flexibility
Switching strategies when something isn't working
53
+0.34
0.003
[+0.13; +0.53]
✓
Self-Management
Inhibitory control
Holding back impulse and returning to focus
53
+0.28
0.014
[+0.06; +0.47]
✓
Self-Management
Respectful communication
Saying what you think with respect, even when disagreeing
56
+0.25
0.030
[+0.02; +0.44]
✓
Social Skills
This pattern is consistent with what evidence shows. These are skills that depend on repeated practice and an environment that allows them to develop. Emotional regulation is not learned in a lecture. It is learned by regulating emotions in a space where it is safe to make mistakes.
Strengths
Strengths are factors with positive correlation with wellbeing and high score. They represent what the programme already delivers well and needs to protect: dimensions that matter and that young people already recognise as present in their lives.
Factor
What it means
Score
ρ
p (FDR)
95% CI
Signif.
Outcome
High expectations
Having adults who believe in and expect the best
74
+0.44
<0.001
[+0.24; +0.60]
✓
Recognition
Habits and routines
Arriving on time and keeping responsibilities
66
+0.51
<0.001
[+0.32; +0.66]
✓
Responsibility
Positive friendships
Having friends who pull toward positive choices
62
+0.48
<0.001
[+0.28; +0.63]
✓
Positive Peer Relationships
Feedback with next step
Receiving feedback that says what to do differently
69
+0.46
<0.001
[+0.26; +0.62]
✓
Recognition
Reference adult
Having a trusted adult to talk to
67
+0.46
<0.001
[+0.26; +0.62]
✓
Trusted Adult
Self-efficacy
Believing you can learn and improve
70
+0.34
0.003
[+0.13; +0.52]
✓
Future Orientation
Clear and useful guidance
Receiving practical guidance on how to improve
63
+0.25
0.029
[+0.03; +0.45]
✓
Trusted Adult
Agency and active voice
Having space to share ideas and take part
69
+0.23
0.042
[+0.01; +0.43]
✓
Personal Development
Participants report having adults who believe in them, who provide practical guidance and feedback on how to improve. They report having a voice, friends who influence positively, and routines that work. The programme delivers the opportunities that matter most for this group's wellbeing.
PART 3: In-depth analysis
This section goes beyond the initial snapshot to empirically test how the programme works, and to show where the effect is strongest.
Testing the Theory of Change — Mediation Analysis
The Rizomas theory says that the environment the programme offers cultivates skills in young people, and that these skills sustain wellbeing. That is the story. But is it an assertion or a fact? To become fact, it needs testing.
It can be tested. The tool is called mediation analysis. What it answers is direct: how much of the effect of the environment on wellbeing passes through the internal skills that young people develop? Does the environment affect wellbeing because of the skills, or independently of them?
The tested model
The analysis considers three aggregated variables:
Opportunities (environment): mean of the 5 opportunity outcomes (Trusted Adult, Nurturing Environment, Positive Peer Relationships, Recognition, Personal Development).
Capabilities (internal skills): mean of the 5 capability outcomes (Self-Management, Emotional Regulation, Social Skills, Responsibility, Future Orientation).
Wellbeing (SWLS): the anchor indicator.
Three paths are estimated:
a: from Opportunities to Capabilities. Does the environment develop skills?
b: from Capabilities to Wellbeing (controlling for Opportunities). Do skills sustain wellbeing even when the environment does not change?
c': from Opportunities to Wellbeing, controlling for Capabilities. How much of the environment's effect on wellbeing happens without having to pass through skills?
The indirect effect (a × b) is the part of the environment's impact that passes through skills. If it is large, the theory is confirmed.
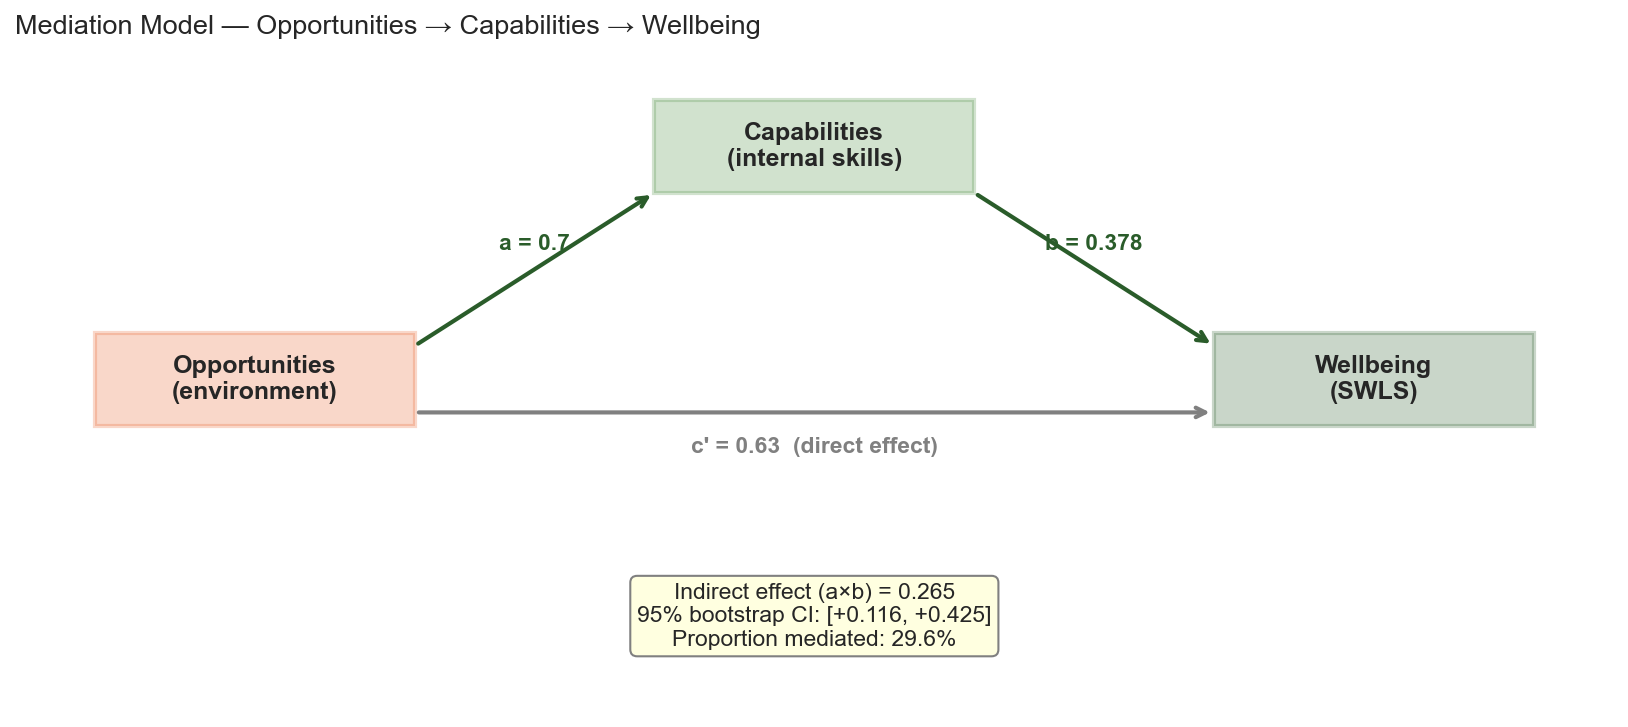
Figure 2. Mediation model. Arrows show the magnitude of effects. The indirect effect (a × b = 0.265) is how much of the environment's impact on wellbeing passes through the internal skills of young people. The 95% bootstrap CI [+0.116; +0.425] excludes zero, confirming significant mediation.
What the numbers show
Path
What it measures
Coefficient
p
a
Opportunities → Capabilities
0.70
<0.001
b
Capabilities → Wellbeing (controlling Opport.)
0.38
<0.001
c
Opportunities → Wellbeing (total effect, no controls)
The environment Rizomas creates is strongly associated with young people's internal skills (a = 0.70). This is the cycle predicted by the programme's theory: nurturing environment, trusted adult, recognition → development of emotional regulation, self-management, future orientation.
Internal skills, in turn, sustain wellbeing (b = 0.38) even when controlling for the environment. It isn't the environment directly that makes a young person feel happy — it's the skills the environment allows them to build.
The indirect effect — the share of the environment's impact on wellbeing that actually passes through skills — is 0.27, with 95% confidence interval [+0.12; +0.43]. The CI does not include zero. The mediation is statistically significant.
The proportion mediated is 30%. This means: about one third of the environment's effect on wellbeing happens through the development of skills. The other two thirds of the effect (c' = 0.63) happen by another path — likely the direct effect of the sense of belonging, safety, and care, without needing to pass through a change in skill.
What this means for Rizomas: the programme's theory of change is partially confirmed empirically. The environment the Institute creates affects young people's wellbeing through two routes. One route is immediate: the young person feels safe, belongs, is valued, and this on its own already sustains wellbeing. The other route is slower, more transformative: the environment cultivates internal skills (emotional regulation, hope, self-management) that sustain wellbeing in the long term, even when the young person leaves Rizomas. Both routes matter, and the programme operates on both at once.
Important caveat: this is a mediation model tested with cross-sectional data. It shows a pattern of association consistent with the theory, not a proof of causation. In 2026, with repeated measures of the same young people, it will be possible to verify whether changes in the environment at one moment precede changes in skills at the next. That would substantially strengthen the causal interpretation.
Do the same factors matter for children and adolescents? — Moderation
Mixing children (≤11 years) and adolescents (12–17) in a single analysis masks important developmental differences. For a 7-year-old, "Future Orientation" carries little weight day to day. For a 15-year-old adolescent, seeing a viable future works as a central protective factor.
This analysis compares, for each outcome, the correlation with wellbeing separately in each age group. Where the difference between the two groups is large, there is an indication that the programme can (or should) act in different ways for each age range.
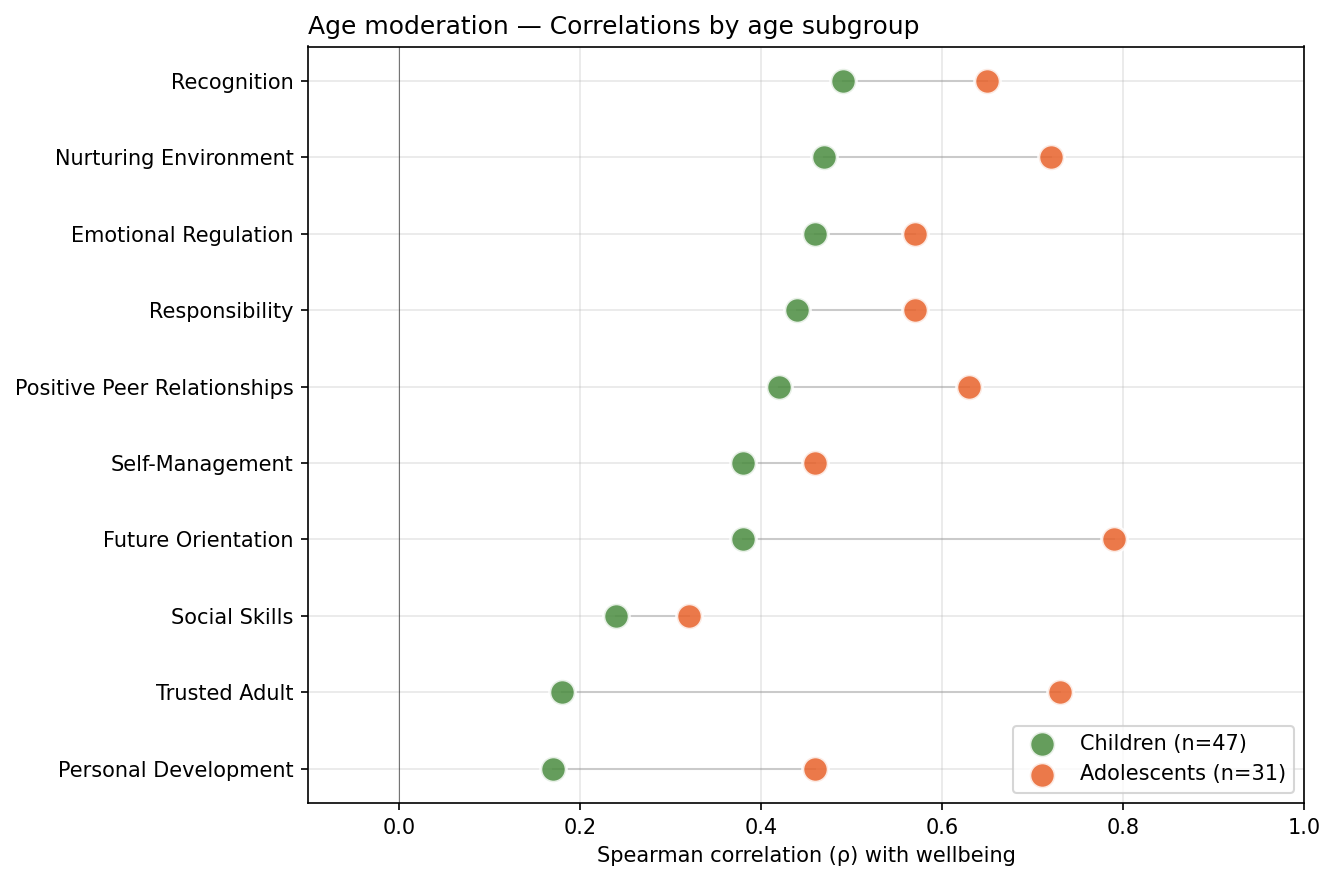
Figure 3. Correlations of each outcome with wellbeing, separated by age group. Green points: children (n=47). Orange points: adolescents (n=31). The grey line connecting the points shows the magnitude of the difference between the groups.
Outcome
Type
ρ Children (n=47)
ρ Adolescents (n=31)
Δρ
p (FDR)
Trusted Adult
Op
+0.18
+0.73
−0.55
0.003
Future Orientation
Cap
+0.38
+0.79
−0.41
0.021
Personal Development
Op
+0.17
+0.46
−0.29
0.135
Nurturing Environment
Op
+0.47
+0.72
−0.25
0.182
Positive Peer Relationships
Op
+0.42
+0.63
−0.21
0.256
Recognition
Op
+0.49
+0.65
−0.16
0.382
Responsibility
Cap
+0.44
+0.57
−0.13
0.496
Emotional Regulation
Cap
+0.46
+0.57
−0.11
0.565
Self-Management
Cap
+0.38
+0.46
−0.08
0.687
Social Skills
Cap
+0.24
+0.32
−0.08
0.718
How to read this
Two outcomes show a statistically significant difference between children and adolescents: Trusted Adult and Future Orientation. Both have a much stronger correlation with wellbeing for adolescents than for children.
Trusted Adult matters for both groups, but for adolescents it is practically decisive (ρ = +0.73). This is consistent with the developmental stage. Younger children still have many adult figures around them (parents, teachers), and the individual weight of a reference adult is diluted. Adolescents are differentiating themselves from their parents and looking for references outside home — when they find an adult who looks at them with real attention, that matters a great deal.
Future Orientation has the same pattern. For children aged 7 to 11, "hope in dreams" and "perseverance" have a looser connection with day-to-day wellbeing. For adolescents, projecting a viable future works as an anchor. Without that anchor, the vulnerability of the territory pulls wellbeing down.
The other 8 outcomes tend to matter equally for both groups (all with positive and significant correlation in both), but without statistical difference between age ranges. This is informative: the programme's foundation works equally well for children and adolescents. What changes is the relative weight of specific dimensions.
Operational implications: for adolescents, specifically strengthening relationships with reference adults and the work on life projects can generate disproportionate return on wellbeing. For children, these factors also matter, but what most sustains wellbeing is the broader combination of a nurturing environment, with positive friendships and recognition. From 2026, with separate collection by age range, it will be possible to refine this further.
PART 4: The Analysis
Where the opportunities are. How time in programme, attendance, and socioemotional participation associate with the results.
Results
Where the opportunities come from
If opportunities are what matter most for wellbeing, the next question is where they come from in these young people's lives.
For each opportunity factor, we asked two questions. The first ("Where do you find this?") allowed multiple applicable contexts to be marked. The second ("Where is this most true for you?") asked for a single choice.
The table below compares how often participants attribute each opportunity to Rizomas and to school, now with a confidence interval for each proportion.
Opportunity Factor
Rizomas
95% CI
School
p (≠ 50%)
Outcome
Clear and useful guidance Receiving practical guidance on how to improve
89%
[80%, 95%]
11%
<0.001
Trusted Adult
Specific process praise Receiving praise that points to effort and progress
85%
[75%, 91%]
15%
<0.001
Recognition
Feedback with next step Receiving feedback that says what to do differently
85%
[75%, 91%]
15%
<0.001
Recognition
Respectful conflict resolution Seeing conflicts resolved with respect and fairness
84%
[74%, 91%]
16%
<0.001
Nurturing Environment
Agency and active voice Having space to share ideas and take part in decisions
81%
[70%, 88%]
19%
<0.001
Personal Development
Realistic high expectations Having adults who expect the best of you
78%
[67%, 86%]
22%
<0.001
Recognition
Overall average
76%
[68%, 83%]
24%
<0.001
—
All proportions have a confidence interval that excludes 50% and p < 0.001. The difference between Rizomas and school is statistically significant across all factors. Rizomas appears as the source of these opportunities at three times the frequency of school. The programme also appears frequently alongside home. It does not replace family. It fills gaps when family cannot offer certain conditions, and provides what public schools in vulnerable contexts can rarely supply.
Association with time in programme
We compared wellbeing and key factors among adolescents with different lengths of time in the programme. Now with n per subgroup, statistical test, and effect size.
♡
45.7
0–1 year
n=7 | SD=11.7
♡
69.2
2 years
n=11 | SD=10.3
♡
71.8
3 years
n=13 | SD=8.7
Mann-Whitney U test (0–1 year vs 3 years): U=1, p < 0.001. Cliff's δ = +0.98 (large effect).
An adolescent with 3 years of Rizomas reports, on average, life satisfaction about 57% higher than a newcomer. The difference is statistically significant and the effect size is large.
Caveat about n per subgroup: the comparison between 0–1 year (n=7) and 3 years (n=13) involves only 20 young people. The effect is large and clear, but with so few respondents in each group, the uncertainty interval around individual estimates is wide. In 2026, with more participants, this analysis will be far more robust. For now, it is a strong indication that needs confirmation.
Adolescence is a phase where wellbeing typically falls. The body changes, social pressures increase, the future feels uncertain. In contexts of vulnerability, that drop tends to be sharper. The pattern observed at Rizomas goes in the opposite direction. The more time in the programme, the higher the reported wellbeing. This is consistent with the hypothesis that the programme acts as a protective factor.
Factors with the largest differences between newcomers and participants with 2+ years:
Factor
New (n=18)
2+ years (n=60)
Δ%
p (FDR)
Cliff's δ
Outcome
Hope — dreams and plans Having dreams and plans, and feeling it's worth trying
31.9
82.4
+159%
<0.001
+0.97 (large)
Future Orientation
Hope — pathways Seeing paths and alternatives to reach goals
44.0
87.4
+99%
<0.001
+0.95 (large)
Future Orientation
Specific process praise Receiving praise that points to effort and progress
31.1
64.0
+105%
<0.001
+0.86 (large)
Recognition
Sustained attention Keeping focus until finishing what you start
44.0
67.8
+54%
<0.001
+0.71 (large)
Self-Management
Habits and routines Arriving on time and keeping routines and responsibilities
58.0
68.0
+17%
0.070
+0.23 (small)
Responsibility
The largest differences are in Future Orientation: having dreams and plans, and seeing pathways to make them happen. Marques, Gallagher, and Lopez (2017), in a meta-analysis of studies on hope in school contexts, found that hope is associated with better academic performance, higher engagement, and lower dropout. For adolescents in contexts of vulnerability, this dimension sustains long-term choices even when the surrounding environment does not cooperate.
Association with attendance in the programme
We compared young people with high attendance (≥90%) and low attendance (≤73%). Each subgroup has about 20 young people — a comparison with reasonable statistical footing within the total n.
Factor
Low (n=21)
High (n=17)
Δ%
p (FDR)
Cliff's δ
Outcome
Care for belongings Taking care of materials and keeping things in order
52.0
80.4
+55%
<0.001
+0.78 (large)
Responsibility
Keeping commitments Following rules and agreements, even when no one is watching
55.0
74.9
+36%
<0.001
+0.66 (large)
Responsibility
Resistance to peer pressure Saying "no" when friends pressure you to do something wrong
54.0
71.0
+31%
0.002
+0.57 (large)
Social Skills
Belonging Feeling part of and able to count on the group
46.0
60.0
+30%
0.003
+0.53 (large)
Positive Peer Relationships
The factors with the largest differences are tied to Responsibility and Social Skills. These are capabilities that depend on practice, routine, and continued engagement.
Part of this association may reflect profile — young people with higher attendance may come from more organised family contexts, where responsibility is already developed at home. But even controlling for that, one factor stands out: resistance to peer pressure (+31%, p = 0.002, large effect). This capability depends less on family context and more on the social environment the young person is in. Adolescents are particularly susceptible to their reference group. When a young person attends frequently, they repeatedly enter a space with commitments, responsibilities, and structured engagement. In a territory taken over by violence and drug trafficking, this is concrete protection.
Association with participation in socioemotional activities
Among the after-school programme participants, those who also take part in the Sunday socioemotional activities show higher levels of Self-Management and Emotional Regulation — the same outcomes that appear as priority needs.
Factor
Non-part. (n=66)
Participates (n=12)
Δ%
p (FDR)
Cliff's δ
Outcome
Regulation strategies Using a pause, breathing, or reappraisal to calm down
40.0
67.8
+70%
<0.001
+0.71 (large)
Emotional Regulation
Emotional awareness Recognising what you're feeling and putting it into words
44.0
71.0
+61%
<0.001
+0.66 (large)
Emotional Regulation
Body signal perception Noticing body signals when getting overwhelmed
51.0
73.3
+44%
<0.001
+0.67 (large)
Emotional Regulation
Cognitive flexibility Switching strategies when something isn't working
50.0
70.9
+42%
<0.001
+0.60 (large)
Self-Management
Important caveat: the socioemotional participant group is small (n=12). The observed differences are large and statistically significant, but with so few respondents the individual numbers can be influenced by specific characteristics of these young people. In 2026, with the expansion of the Sunday programme, this analysis will gain robustness.
The young people who take part in Sunday activities are also completing their second year of the after-school programme at the time the measurement was carried out. The observed differences likely reflect the combination of both fronts. The after-school programme offers daily exposure to a structured environment where these capabilities are practised in the everyday, with frequency and consistency. Sunday complements this with a different format: voluntary, lighter, associated with projects and play, without the weight of the school day. One hypothesis is that daily practice builds the foundation and the Sunday format helps consolidate it, in a context where the young person is more receptive. Isolating each effect would require a separate analysis, planned for the next cycle.
Participant profiles — Exploratory Analysis
This analysis asks a simple thing: within the 78 young people served, are there subgroups with distinct profiles of capabilities and opportunities?
The answer has practical value. Identifying profiles helps personalise the work — young people in a more fragile situation can receive differentiated attention, more robust young people can be invited to lead activities, and the programme gains a concrete way to track movement between profiles over time.
How it was done
We used an algorithm called K-means, which groups people with similar profiles. The algorithm automatically finds the most cohesive groupings, without us having to pre-define who goes with whom. We tested several possible numbers of groups (2, 3, 4, and 5) and the quality criterion (silhouette score) indicated that 3 groups represent the structure of the data well.
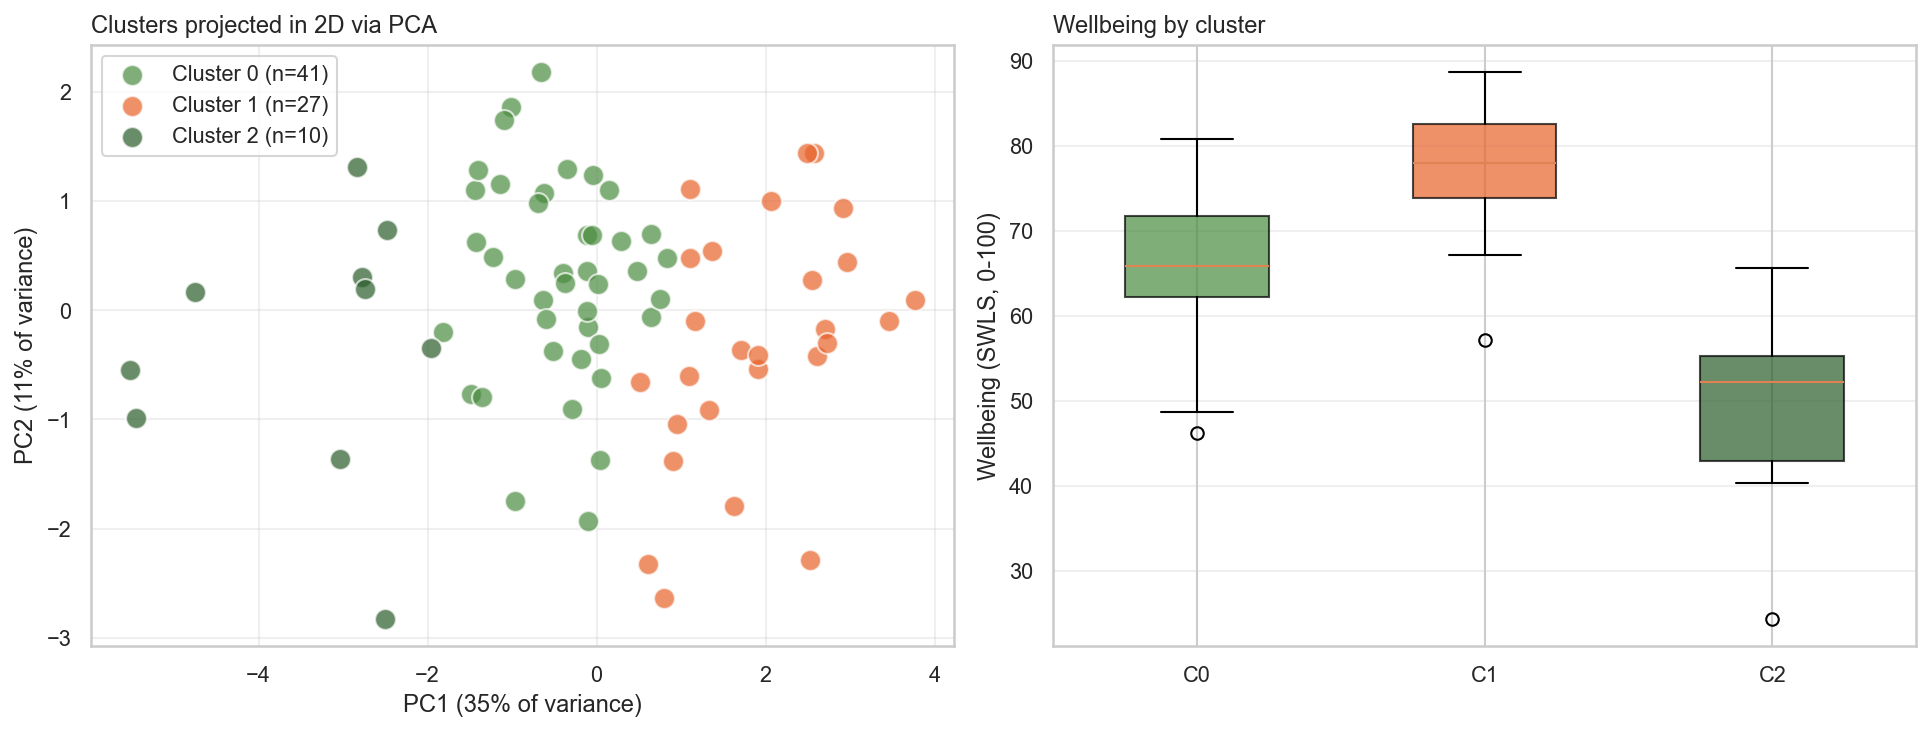
The analysis uses the 10 standardised outcomes as the basis for finding the profiles. The visualisation below projects the 78 young people onto two summary dimensions (via PCA), so it is possible to see visually how they separate.
Figure 4. Left: 78 young people projected onto two summary dimensions. Each colour is a profile identified by the analysis. Right: distribution of wellbeing by profile.
The three identified profiles
Profile
n
%
Wellbeing
% adolescents
High points
Low points
Profile 1 — Typical middle
41
53%
66.2
37%
Positive Peer Relationships, Trusted Adult
—
Profile 2 — Flourishing
27
35%
77.1
41%
Positive Peer Relationships, Emotional Regulation
Personal Development, Trusted Adult
Profile 3 — Struggling
10
13%
49.4
50%
Emotional Regulation, Social Skills
Future Orientation, Recognition
What each profile suggests
Profile 1 — Typical middle (53% of young people). Wellbeing close to the overall mean. Shows reasonable levels across all outcomes, without notable peaks or large gaps. Probably the "standard profile" of the programme — young people already benefiting from the Rizomas environment, but with room to grow across several dimensions.
Profile 2 — Flourishing (35% of young people). Wellbeing substantially above the mean (77.1 vs 67.8 overall). Stands out in positive friendships and emotional regulation. Interestingly, this profile has relatively lower scores on some "environment" elements — suggesting that these young people have managed to develop robust internal capabilities that sustain wellbeing more autonomously. In other words: the skills are already working. They may be natural candidates for leadership roles in programme activities.
Profile 3 — Struggling (13% of young people — 10 young people). Wellbeing considerably below the mean (49.4). The most fragile group. Shows important gaps in Future Orientation and Recognition — two of the outcomes most linked to wellbeing in this sample. The proportion of adolescents in this group is higher (50%), consistent with the pattern that adolescence amplifies vulnerabilities when the foundation of support is fragile. This is the group that would benefit most from differentiated attention from educators.
Important caveat: this analysis is exploratory. With n=78, the profiles identified could change substantially in another sample. Do not use these three groups as fixed labels for individual young people — use them as a tool for collective reading. When the longitudinal data from 2026 arrive, it will be possible to see who moved between profiles over time. That is, perhaps, the most valuable use of this analysis: preparing the ground for measuring the programme's individual effect from here on.
PART 5: Conclusions and next cycle
Conclusions and Next Cycle
This cycle delivered what it set out to do. It built an initial snapshot of participants' wellbeing, identified which factors most matter for that wellbeing, mapped priority needs and strengths, and found consistent signals of association between programme participation and the observed outcomes. The mediation and age moderation analyses add layers that show how the programme works and for whom it works best in each dimension.
What we learned
The theory of change holds up empirically. The mediation analysis confirmed that part of the effect of the Rizomas environment on young people's wellbeing passes through the development of internal capabilities — exactly as the programme's theory of change claims. About 30% of the effect is mediated by skills, and the other 70% happens through a direct route (sense of belonging, safety, care).
Children and adolescents need different things. For adolescents, Trusted Adult and Future Orientation carry far more weight on wellbeing than for children. This does not mean these factors do not matter for children (they have positive correlation too), but investment in these dimensions yields a disproportionate return for adolescents.
The profile of the 10 struggling young people needs attention. The cluster analysis identified a subgroup of 13% of participants with wellbeing substantially below the mean and gaps in Future Orientation and Recognition. These are young people eligible for differentiated support within the programme. In future cycles, it is worth tracking how many leave this profile — that will be the most direct signal of the individual effect of Rizomas.
What guides the next cycle
The cross-sectional design allowed group comparisons but not individual tracking. From 2026 onwards, measurement will include repeated measures of the same participants over time. With this, it will be possible to observe individual change. How much a specific young person has advanced in emotional regulation over the course of a year. What differentiates those who advance faster. Which programme activities are most associated with the development of each capability.
The application of instruments in 2025 revealed that some questions were not clear enough for participants' age range and context. These items were revised and adjusted for the 2026 cycle, with a new round of pilot testing.
The 2026 cycle has already collected the baseline with new entrants to the after-school programme. The second measurement happens at the end of the year. This will allow, for the first time, the same young person to be compared at two different moments and real change to be measured over time.
Suggested methodological improvements
We have also identified ways to strengthen the measurement further in coming cycles:
Separate analyses for children and adolescents — already planned, validated by the findings of the moderation analysis.
Confirmatory factor analysis — with larger n in future cycles, it is worth empirically testing whether the 10 theoretical outcomes emerge as 10 distinct dimensions in the data, or whether some can be combined.
Comparison group — young people eligible but not served (waiting list, or similar neighbouring area). Without this, part of the observed effects may reflect natural maturation, not the programme.
A priori power analysis — to detect small correlations (ρ ≈ 0.30) with adequate statistical power, n ≈ 85 is needed for the total sample and considerably more for subgroup comparisons. It is worth projecting sample size before collection.
Pre-registration of the analysis plan — declaring before data collection which hypotheses are confirmatory and which are exploratory reduces analytical selectivity and increases credibility.
Sharing the anonymised dataset and analysis code — allows reanalysis by third parties and strengthens the programme's methodological position in conversations with donors and international partners.
Limitations that need to remain explicit
Rizomas operates with methodological seriousness, and methodological seriousness means clearly recognising where the evidence is strong and where it needs more robustness. These limitations remain:
Self-report (social desirability bias, especially among young people inside the programme itself).
Absence of a control group in this phase.
Sample size limits statistical power for small correlations and comparisons between small subgroups.
Cross-sectional design prevents causal claims. Only associations.
The measurement evolves alongside the programme. The first cycle tested the approach and generated the first evidence. The next deepens it.
Glossary
Measurement Concepts
Wellbeing (anchor indicator). The assessment a person makes of their own life as a whole. Measured by the Satisfaction With Life Scale (SWLS). Functions as the central indicator of the measurement. If wellbeing improves, life has improved. If it does not improve, regardless of what happened in the parts, the final result has not changed.
Outcomes. The dimensions that influence wellbeing. Divided into capabilities and opportunities. They are the intermediate level of measurement, between general wellbeing and specific factors.
Capabilities. What a person can do and be. Internal skills that can be developed. When a capability is low, the path is to develop it. Examples: emotional regulation, self-management, social skills.
Opportunities. What the environment offers. External conditions to which the person does or does not have access. When an opportunity is absent, the path is to provide it. Examples: trusted adult, nurturing environment, positive friendships.
Factors. The specific, measurable indicators within each outcome. They are the level that allows concrete action. "Emotional Regulation" is an outcome. "Recognising what you're feeling and putting it into words" is a factor. Each factor corresponds to a question in the data collection instrument.
Priority need. Factor with high correlation with wellbeing and a low score in the group. Matters a lot and is still weak. Represents where there is most room for growth and the greatest return potential.
Strength. Factor with high correlation with wellbeing and a high score in the group. Matters a lot and is already working. Represents what the programme delivers well and needs to protect.
Action filter. Methodological criterion that prioritises, in the measurement, factors over which the programme has capacity for influence. Real factors but outside the programme's reach (sanitation, public safety, income) remain in the territorial diagnostic, but do not enter the data collection instrument.
Cross-sectional design. A research design that measures all participants at a single point in time. It allows comparison between different groups (for example, newcomers vs. participants with 2+ years), but the differences found represent association, not causation.
Statistical Concepts
ρ (rho) — Spearman correlation. Measures how much two variables vary together, without assuming a strictly linear relationship. Ranges from −1 to +1. The farther from zero, the stronger the relationship. Robust to non-normal distributions and appropriate for Likert scales.
p (p-value). Probability of obtaining the observed result (or a more extreme one) if the null hypothesis were true. By convention, p < 0.05 indicates that the result is unlikely to have occurred by chance. It is not the probability that the hypothesis is true.
95% CI — Confidence Interval. Range in which the true value of the parameter has a 95% chance of falling. For correlations, computed via Fisher z transformation. The narrower it is, the more precise the estimate. For n=78, CIs are naturally wide.
Cliff's δ. Effect size for comparisons between two groups with Mann-Whitney. Ranges from −1 to +1. |δ| < 0.15 is negligible, |δ| ≈ 0.33 is medium, |δ| > 0.47 is large. Unlike p, does not depend on sample size.
Mann-Whitney U. Non-parametric test for comparing two independent groups. Assesses whether the distributions differ in location. Robust to outliers and skewed distributions. Used instead of the t-test when assumptions are unclear.
FDR correction (Benjamini-Hochberg). Adjustment for multiple comparisons that controls the false discovery rate — the proportion of positive findings that are in fact false. More appropriate than Bonferroni in exploratory analysis, where some risk is accepted in exchange for not missing real findings.
Mediation analysis. Statistical model that decomposes the effect of a variable X on Y into a direct effect (X → Y) and an indirect effect (X → M → Y) through a mediator M. The confidence interval of the indirect effect, computed by bootstrap, indicates whether the mediation is statistically significant.
Bootstrap. Resampling technique that estimates the distribution of a statistic by drawing, with replacement, thousands of samples from the original data. Allows computation of confidence intervals without assuming a theoretical distribution. Used in mediation analysis (5,000 samples).
Cluster analysis (K-means). Unsupervised method that groups observations with similar profiles. The algorithm finds k groups that minimise within-group variance. Silhouette score assesses grouping quality.
Bibliographic References
The capabilities and opportunities measured in this study are supported by consolidated scientific evidence. Below are the main references organised by area.
Aldao, A., Nolen-Hoeksema, S., & Schweizer, S. (2010). Emotion-regulation strategies across psychopathology: A meta-analytic review. Clinical Psychology Review, 30(2), 217–237.
Benjamini, Y., & Hochberg, Y. (1995). Controlling the false discovery rate: A practical and powerful approach to multiple testing. Journal of the Royal Statistical Society B, 57(1), 289–300.
Chetty, R., Jackson, M. O., Kuchler, T., Stroebel, J., et al. (2022). Social capital I: Measurement and associations with economic mobility. Nature, 608, 108–121.
Diener, E., Emmons, R. A., Larsen, R. J., & Griffin, S. (1985). The Satisfaction With Life Scale. Journal of Personality Assessment, 49(1), 71–75.
DuBois, D. L., Portillo, N., Rhodes, J. E., Silverthorn, N., & Valentine, J. C. (2011). How effective are mentoring programs for youth? A systematic assessment of the evidence. Psychological Science in the Public Interest, 12(2), 57–91.
Duckworth, A. L., & Seligman, M. E. P. (2005). Self-discipline outdoes IQ in predicting academic performance of adolescents. Psychological Science, 16(12), 939–944.
Durlak, J. A., Weissberg, R. P., Dymnicki, A. B., Taylor, R. D., & Schellinger, K. B. (2011). The impact of enhancing students' social and emotional learning: A meta-analysis of school-based universal interventions. Child Development, 82(1), 405–432.
Gouveia, V. V., Milfont, T. L., da Fonseca, P. N., & Coelho, J. A. P. M. (2009). Life Satisfaction in Brazil: Testing the psychometric properties of the Satisfaction With Life Scale (SWLS) in five Brazilian samples. Social Indicators Research, 90(2), 267–277.
Gross, J. J., & John, O. P. (2003). Individual differences in two emotion regulation processes: Implications for affect, relationships, and well-being. Journal of Personality and Social Psychology, 85(2), 348–362.
Hattie, J., & Timperley, H. (2007). The power of feedback. Review of Educational Research, 77(1), 81–112.
Hayes, A. F. (2018). Introduction to mediation, moderation, and conditional process analysis: A regression-based approach (2nd ed.). Guilford Press.
Marques, S. C., Gallagher, M. W., & Lopez, S. J. (2017). Hope- and academic-related outcomes: A meta-analysis. School Mental Health, 9(3), 250–262.
Moffitt, T. E., Arseneault, L., Belsky, D., Dickson, N., Hancox, R. J., Harrington, H., et al. (2011). A gradient of childhood self-control predicts health, wealth, and public safety. Proceedings of the National Academy of Sciences, 108(7), 2693–2698.
Pavot, W., & Diener, E. (2008). The Satisfaction With Life Scale and the emerging construct of life satisfaction. The Journal of Positive Psychology, 3(2), 137–152.
Rede Nossa São Paulo (2024). Mapa da Desigualdade 2024. São Paulo.
Roorda, D. L., Koomen, H. M. Y., Spilt, J. L., & Oort, F. J. (2011). The influence of affective teacher–student relationships on students' school engagement and achievement. Review of Educational Research, 81(4), 493–529.
Taylor, R. D., Oberle, E., Durlak, J. A., & Weissberg, R. P. (2017). Promoting positive youth development through school-based social and emotional learning interventions: A meta-analysis of follow-up effects. Child Development, 88(4), 1156–1171.
Thapa, A., Cohen, J., Guffey, S., & Higgins-D'Alessandro, A. (2013). A review of school climate research. Review of Educational Research, 83(3), 357–385.
Wang, M.-T., & Degol, J. L. (2016). School climate: A review of the construct, measurement, and impact on student outcomes. Educational Psychology Review, 28(2), 315–352.
Werner, E. E., & Smith, R. S. (1992). Overcoming the odds: High risk children from birth to adulthood. Cornell University Press.
Werner, E. E., & Smith, R. S. (2001). Journeys from childhood to midlife: Risk, resilience, and recovery. Cornell University Press.
ANNEXES
Annex 1: Measured Factors and Definitions
Capabilities — Self-Management
Factor
Definition
Sustained attention
Keeping focus until finishing what you start.
Inhibitory control and recovery after distraction
Holding back impulse and returning to focus after being distracted.
Cognitive flexibility
Switching strategies when something is not working.
Planning
Organising tasks into steps and preparing ahead.
Capabilities — Emotional Regulation
Factor
Definition
Emotional awareness
Recognising what you're feeling and being able to put it into words.
Perception of body signals
Noticing body signals when starting to feel overwhelmed.
Regulation strategies
Using pause, breathing, or reappraisal to calm down.
Returning to the goal after frustration
Returning to the task and continuing after feeling frustrated.
Capabilities — Social Skills
Factor
Definition
Empathy
Noticing how the other is feeling and acting with consideration.
Respectful communication
Saying what you think with respect, even when disagreeing.
Resistance to peer pressure
Saying "no" when friends pressure you to do something wrong.
Non-aggressive conflict resolution
Resolving conflicts without name-calling, threats, or hitting.
Capabilities — Responsibility
Factor
Definition
Keeping commitments
Following rules and agreements, even when no one is watching.
Care for belongings
Taking care of materials and keeping things in order.
Habits and routines
Arriving on time and keeping routines and responsibilities.
Honesty and integrity
Telling the truth and acting with integrity in difficult situations.
Capabilities — Future Orientation
Factor
Definition
Self-efficacy
Believing that you can learn and improve with effort.
Hope (dreams and plans)
Having dreams and plans, and feeling it's worth trying.
Hope (pathways)
Seeing paths and alternatives to reach goals.
Perseverance
Persisting and trying again when you don't get it right the first time.
Opportunities — Trusted Adult
Factor
Definition
Reference adult
Having a trusted adult to talk to when needed.
Clear and useful guidance
Receiving practical guidance on how to improve, with examples and clarity.
Encouragement
Being encouraged by adults who believe in your potential.
Fair structure and limits
Living with clear and fair limits, applied with respect.
Opportunities — Nurturing Environment
Factor
Definition
Psychological safety
Feeling that you can be who you are, without fear of humiliation.
Clear and fair rules
Seeing clear and fair rules, applied equally.
Predictability
Knowing what will happen and what is expected.
Respectful conflict resolution
Seeing conflicts resolved with respect and fairness.
Respected learning pace
Having time and support to learn at your own pace.
Opportunities — Positive Peer Relationships
Factor
Definition
Pro-social peer norms
Spending time with peers who value studying, trying, and following rules.
Positive friendships
Having friends who pull toward positive choices.
Group support
Being able to count on friends when needed.
Risk invitations
Receiving fewer invitations and pressure into risky situations.
Opportunities — Recognition
Factor
Definition
Specific process praise
Receiving praise that points to effort, strategy, and progress.
Valuing effort
Having effort and strategy recognised, even without a perfect result.
Recognition of progress
Having progress noticed and acknowledged over time.
Opportunities — Personal Development
Factor
Definition
Meaningful learning
Learning things that make sense and spark curiosity.
Application of learning
Using what you learn in other contexts of life.
Agency and active voice
Having space to share ideas and take part in decisions.
Positive role models
Having contact with people who inspire and show possible paths.
Annex 2: Social Impact Model
The social impact model organises the programme's logic into a chain that connects what Rizomas invests, does, delivers, and changes in participants' lives.
Impact
Improve the wellbeing of children and adolescents in contexts of vulnerability, so that they are in the best position to reach their potential and live a life they value.
Outcomes (capabilities and opportunities)
Rizomas reaches this impact by developing capabilities and providing access to opportunities.
Capabilities
Self-Management. Sustained attention, inhibitory control, cognitive flexibility, planning. Moffitt et al. (2011) followed 1,000 children for 32 years and found that the level of self-control in childhood predicts health, income, and criminal involvement in adult life, independently of intelligence and family social class.
Emotional Regulation. Emotional awareness, perception of body signals, regulation strategies, recovery after frustration. Aldao, Nolen-Hoeksema, and Schweizer (2010), in a meta-analysis of 114 studies, found that emotional regulation strategies are among the factors most associated with mental health in children and adolescents.
Social Skills. Empathy, respectful communication, resistance to peer pressure, non-aggressive conflict resolution. Durlak et al. (2011), in a meta-analysis of 213 social-emotional learning programmes involving 270,034 students, found gains in social skills, reduced behaviour problems, and improved academic performance.
Responsibility. Keeping commitments, care for belongings, habits and routines, honesty and integrity. The measurement data show that habits and routines have a correlation of 0.51 with wellbeing, one of the highest among all measured factors.
Future Orientation. Self-efficacy, hope (dreams and pathways), perseverance. Marques, Gallagher, and Lopez (2017), in a meta-analysis on hope in school contexts, found that hope is associated with better academic performance, higher engagement, and lower dropout.
Opportunities
Trusted Adult. Reference adult, clear and useful guidance, encouragement, fair structure and limits. DuBois et al. (2011), in a systematic review of 73 studies on mentoring programmes, concluded that the presence of a stable reference adult is one of the most consistent protective factors for young people in vulnerability. Werner and Smith (1992, 2001), in the Kauai longitudinal study that followed 698 at-risk children for 40 years, identified that the presence of at least one stable and caring adult was the factor that most distinguished the children who managed to develop despite adversity.
Nurturing Environment. Psychological safety, clear and fair rules, predictability, respectful conflict resolution. Thapa et al. (2013) reviewed the literature on school climate and found that the perception of safety and fairness in the environment is associated with higher engagement, lower dropout, and better mental health.
Positive Peer Relationships. Pro-social norms, positive friendships, group support, belonging. Chetty et al. (2022), using data from 21 million people in the United States, demonstrated that social capital, particularly connection with people from diverse contexts, is one of the factors most associated with economic mobility.
Recognition. Specific praise, valuing effort, feedback with next step, high expectations. Hattie and Timperley (2007), in a review of more than 500 meta-analyses, found that specific feedback about the process (and not about the person) is one of the interventions with the greatest effect on learning.
Personal Development. Meaningful learning, application of learning, agency, positive role models. Roorda et al. (2011) found that affective relationships with educators increase school engagement, and that this effect is stronger in students from vulnerable contexts.
INSTITUTORIZOMAS
Technical Social Impact Report 2025
The wellbeing of children and adolescents in Capão Redondo
Measurement: SIC — Social Impact —
Organisation: Instituto Rizomas —
Location: Capão Redondo, São Paulo —
Date: 2025